Wifi Report
All information relating to bus lot Wi-Fi can be found in the Wifi Report. When you open the Wifi Report page, you will see in the top right corner two view options:
The option on the left takes you to a Wi-Fi signal strength report presented as a list, and the option on the right presents a signal strength map.
Wi-Fi Signal Strength Report
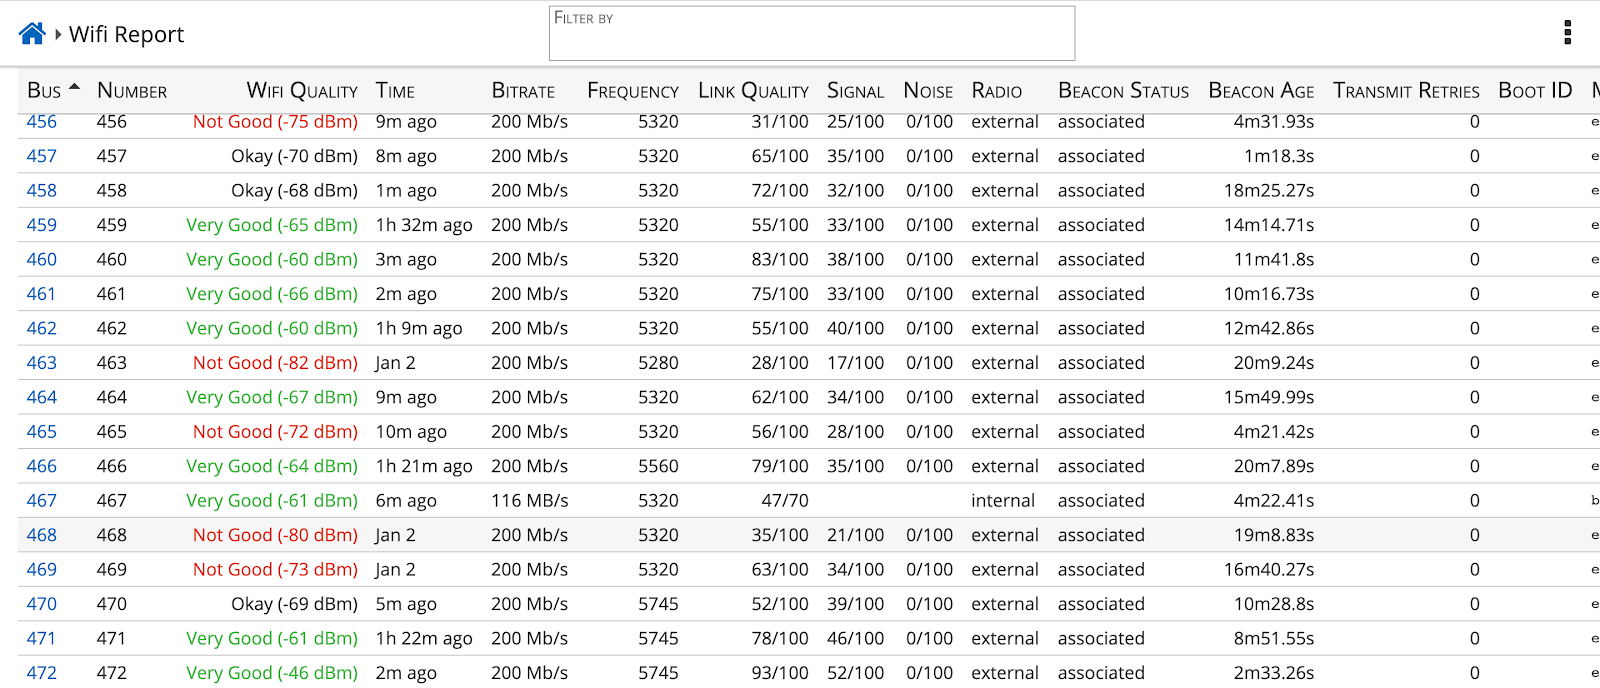
Every time your bus connects to the bus lot Wi-Fi you’ll get a report on the signal the bus is receiving. The information on this page can help highlight areas that have poor coverage. If a bus is live within a Wi-Fi network and reliably connecting, you should see the time column update every 10 minutes.
Signal strength can range from “Unusable” to “Very Good”. Offloading a video from a bus with a weak signal will take a long time! If this is the case, try moving the bus closer to a Wi-Fi antenna if it’s not getting a good Wi-Fi signal. See Bus Lot Wireless Network Installation Guidelines for more information, and contact your IT department for the coverage questions.
Wi-Fi Signal Strength Map
The best time to check the bus lot Wi-Fi map is about 20 minutes after buses have returned from their route. At this time all the buses will be connecting to Wi-Fi and providing you a good indication of the signal strength.
By default, you will be taken to a map, but by clicking the map icon above the star icon on the right you will get a satellite view of your bus lot, as seen below. You may need to zoom in using the plus button to get a detailed view of the bus lot.
A bus’s Wi-Fi signal strength is indicated by a colored dot with a colored border. The color of the dot indicates the bus’s Wi-Fi connection strength:
- Green = Very Good
- Yellow = Okay
- Red = Not Good
The color of the dot’s border matches the connection point color on the left. By clicking on the eye icon, connection points can be hidden or returned to view.
In the illustration below you can see the buses that have connected to a single connection point. The connection information on the left shows that seven buses are connected to this point and seven dots are displayed in the parking lot. Ideally you want less than 10, and certainly no more than 15, buses connected to a single connection point. In our example below, you will see that four of those buses have a very good Wi-Fi connection while the remaining three have an okay connection.
Clicking on an individual bus will bring up its Wi-Fi connection history on the right. The line represents Wi-Fi connection strength over time. For bus 504 we can see that on June 4th it had a good signal in the morning, but a poorer signal later.
Best Practices & Troubleshooting
The best time to evaluate your bus lot signal strength is about 20 minutes after the buses return from running their route. At this time all systems should be connected or trying to connect to the bus lot Wi-Fi. The systems stay active as a default for three hours to allow any requested video to offload. Schools can adjust this timer as desired.
When troubleshooting, the goal should be to identify buses that have a less than optimal Wi-Fi signal strength and work to correct those first. Start with the buses in red and work to get them to yellow. Then work to get yellow to green.
Things to Look For
Are there too many buses connected to a single access point? We recommend a maximum of 10-15 buses per access point. You can turn on access points individually on the left to see how many are connected.
If there are several buses in an area that are red and/or yellow, you may need to add an additional access point in that area.
Be aware that due to the reflection off other buses, the signal strength for an individual bus may vary as other buses move or are parked around the bus.
Limitations
The Wi-Fi signal strength map only measures the strength of the Wi-Fi signal and the buses' ability to connect to it. It does not measure the quality of the upstream connection, so even green might not be working adequately. For example, the upstream could be slow, or the backhaul link between one or more access points and the upstream could be slow, or an upstream firewall could be interfering with data flow. Work with your IT department to resolve these issues. Should your IT department need support to understand the information and develop plans, have them contact support@transportant.com.
Related Articles
Ridership Report
We will be writing guidance on the Ridership Report soon.Miles Traveled This Month
Clicking on “X miles traveled this month” will take you to the Mileage Report page. You can pull reports by Month, Week, Day, or Hour.Checklist Submissions
Once a driver completes and submits a Checklist from the CoPilot, you can access the report under “Checklist Submissions” where the submissions will be labeled with checklist name, bus number, and date of completion. Click on the report you wish to ...Route Performance
Route Performance gives an overview of the planned routes vs. actual. This tile on the dashboard is great for route and time management. You can search by route in the upper right corner of the page. This page displays information such as the time it ...Checklist Forms
You can create checklists on your dashboard to show up for drivers on the copilot. These checklists can include pre-trip checklists, safety checklists, maintenance checklists, and more. Click the blue + in the top right corner of the page. Title your ...