Cell Data
General Notes
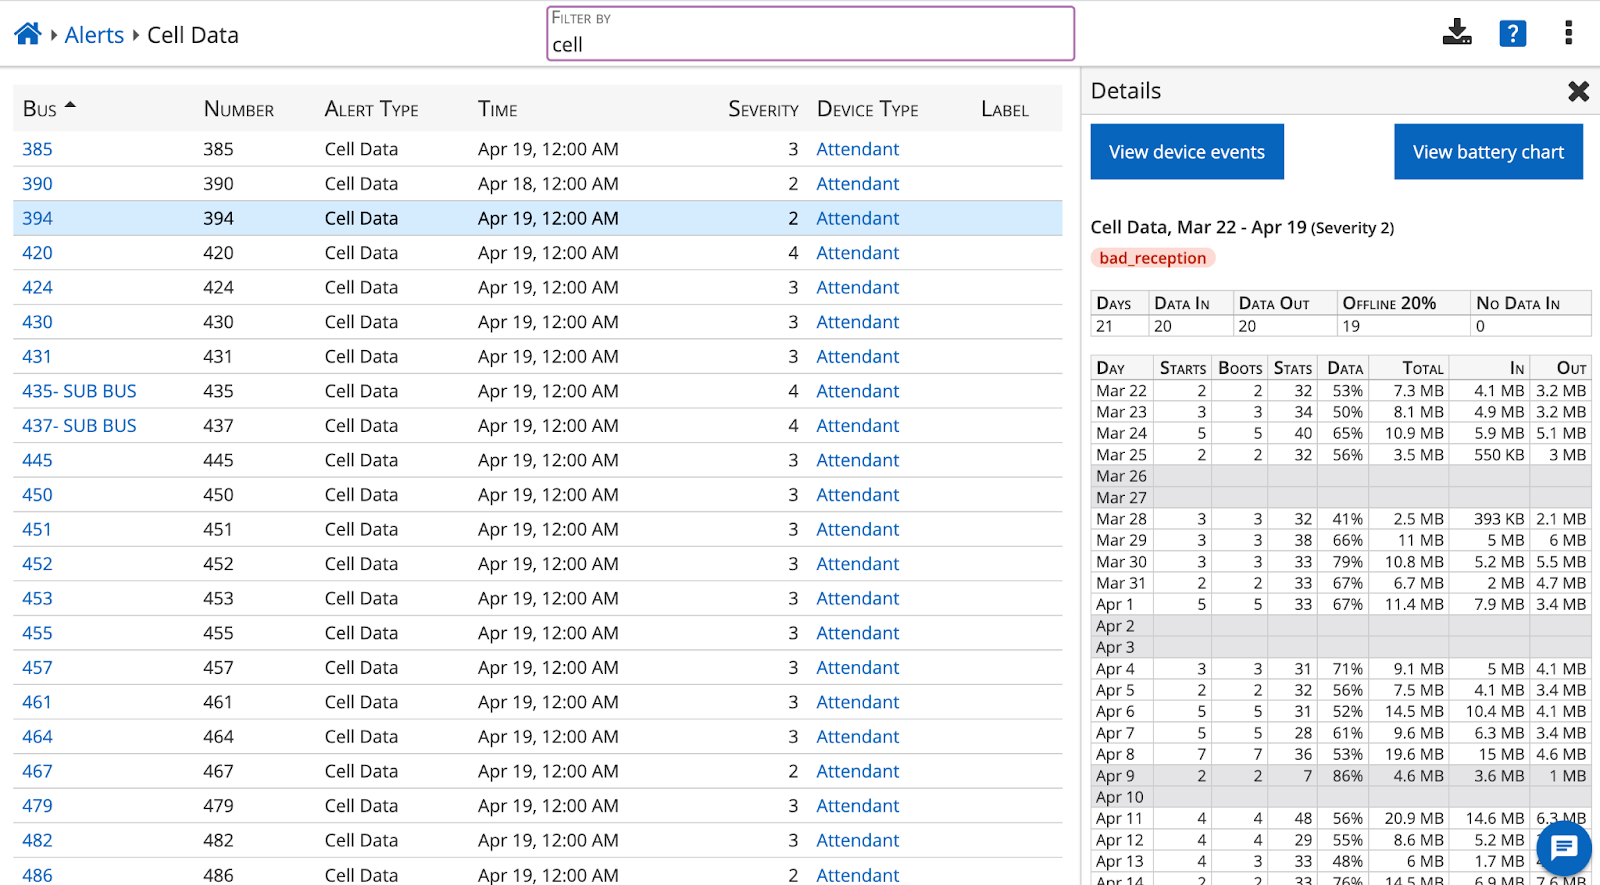
Cell data alerts are broken down into different types: no data in, bad reception, and excess usage (see below).
The severity of each alert is expressed on a scale from 1 to 4, going up based on number of days the bus has the issue.
These alerts are tied to the attendant, not the bus. That means that if you swapped attendants recently, for example as part of your troubleshooting efforts, these reports will give you information from the most recent attendant swap.
These alerts, like most, are calculated on a rolling average, so even after correcting the problem the alert will remain visible for a few days. However, by clicking through to the detail page as seen above, you can see if you have successfully fixed the problem.
No Data In
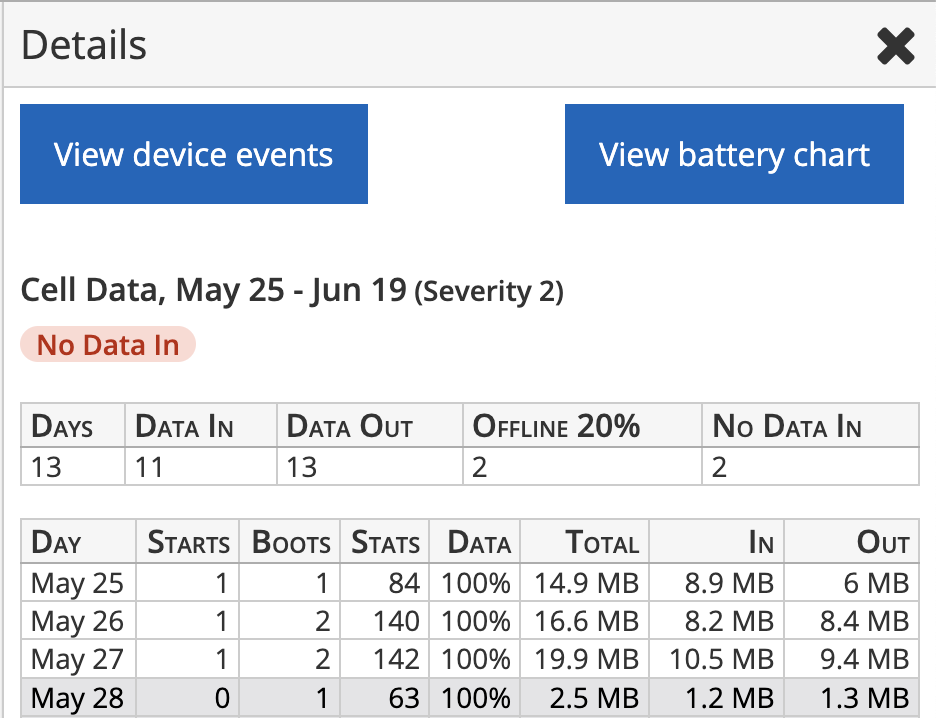
This alert appears when there have been recent days in which less data than expected has been received by the attendant. In the example above, two out of the most recent 13 days are being called to your attention.
The example shown is severity 2. If you observe a severity 3 or 4 alert, swap the attendant with a known good one from another bus:
- If the alert moves with the attendant to the another bus, that suggests that the attendant may have gone bad or has not received an update. Contact Customer Success at support@transportant.com to arrange for next steps.
- If the alert remains on the original bus, that suggests the antenna on the bus may have gone bad. Contact Customer Success at support@transportant.com to purchase a new antenna.
Bad Reception
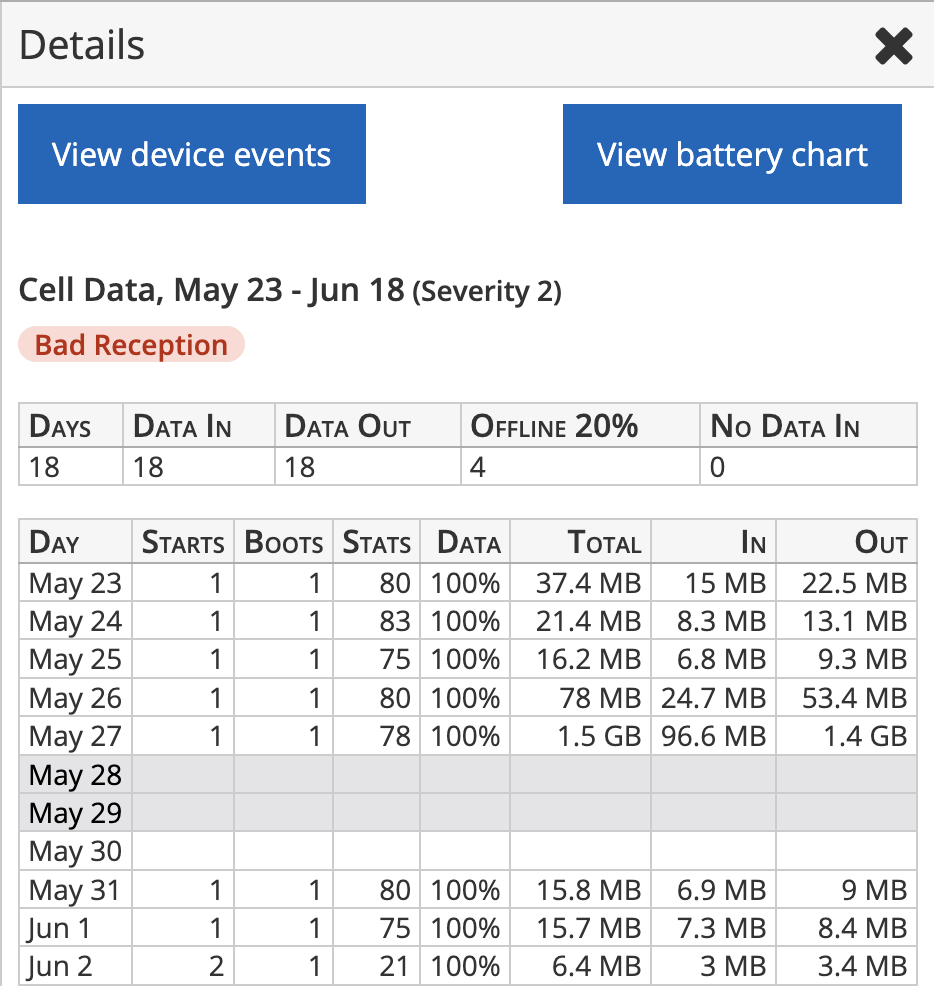
We consider reception to be healthy if least 80% of the WWAN stats have data going through. This alert appears when reception has been worse than that. This alert will always be a severity 1 or 2.
When diagnosing this alert, consider the possibility that this bus drives through cellular dead zones, which would cause this alert.
If you observe this alert and you have ruled out cellular dead zones, begin by pressing the attendant's red reset button when the attendant is online. If that does not help, or if the attendant is an old v3 that does not have a reset button, then do as described for the No Data In alert: Swap the attendant with a known good one from another bus, and proceed according to the result.
Excess Usage
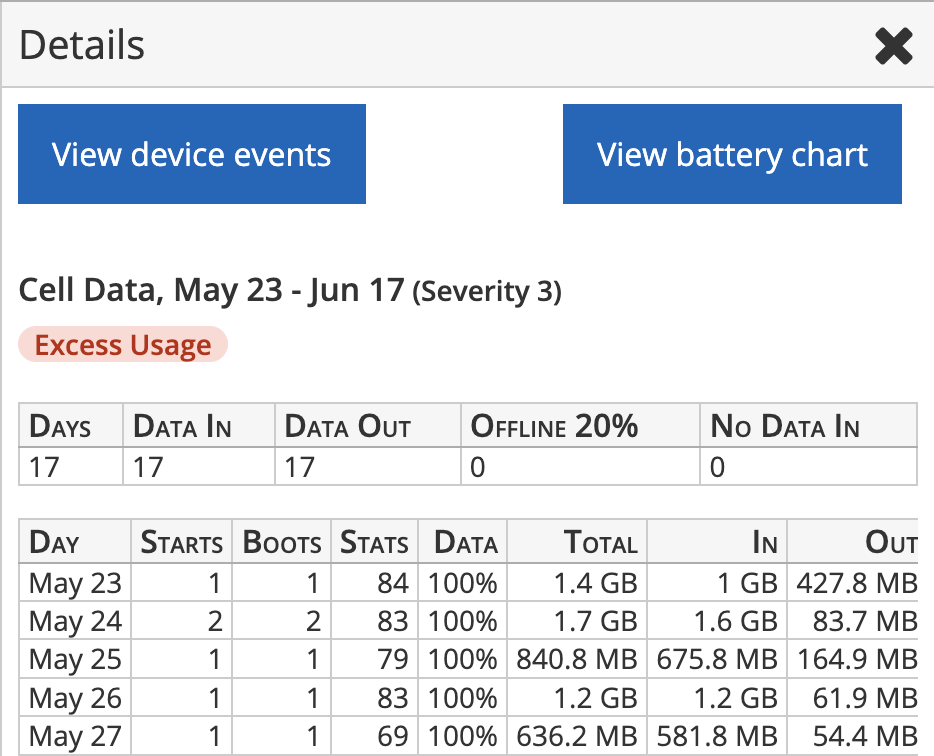
This alert calls to your attention that more cellular data than expected is being used. The cause is usually students making considerable use of onboard Wi-Fi, which consumes cellular data.
Related Articles
Data Import
The data import page, found in the Administrative Tools section of the dashboard, shows the most recent file uploads. Files are either manually uploaded to the dashboard, sent over HTTP or SFTP connection, or sent from routing software. If your ...Manually Adding and Deleting Data
Most districts use automated or bulk means to upload their SIS and routing data, and we recommend you do that as well. However you can add or delete data manually. Any subsequent automated or bulk upload will overwrite your manually entered data. ...Live Video
The Live Video tile is found in the Audio/Video section. Select which bus you would like to access by opening the drop-down menu in the upper left-hand corner. Any bus which is online will show up. If the bus you want is offline, you will need to ...Filtering and Sorting
Most sections have the ability to sort and filter data. For instance, you can search for all students named Jayden or all routes assigned to bus #1. You can also sort most data in ascending or descending order. On pages with historical data you’ll ...Schools
This tile displays a list of schools in your district. These come from the data import through the students.csv file.